
Trump’s August 1 tariffs average may be 5% lower than April 2

·
But at around 22% weighted average new tariffs,
it’s still substantially higher than the 2.5% pre-Trump 2.0
·
Both US importers and global exporters would have
to bear at least 70% higher Trump tariffs to minimize the impact on US
consumers and overall US stagflation
·
If US importers and global exporters absorb a major
portion of Trump tariffs, it may cause subdued EBITDA margins and bottom-line
for both Wall & Global Street
·
On July 9, Wall Street surged as Trump sounded soft
on China, while NVIDIA boosted on China AI Chip optimism; techs rallied
President Donald Trump
has recently escalated his trade policy by sending letters to many countries,
announcing new tariff rates effective August 1, 2025, unless fresh trade deals
are reached. These letters, posted on Truth Social, outline
"reciprocal" tariffs (20-50%) aimed at addressing the perceived U.S.
trade deficit, which Trump considers a national emergency. The countries
targeted include Japan, South Korea, Malaysia, Kazakhstan, South Africa, Laos,
Myanmar, Tunisia, Bosnia and Herzegovina, Indonesia, Bangladesh, Serbia,
Cambodia, Thailand, and Brazil.
Tariff rates vary,
with Brazil at the highest so far at 50%, Laos and Myanmar facing the 2nd
highest at 40%, Cambodia and Thailand at 36%, Bangladesh and Serbia at 35%,
South Africa at 30%, and Japan, South Korea, Malaysia, and Kazakhstan at 25%. All
these new tariffs are inclusive of 10% basic/universal tariffs now. Trump may
impose 10% minimum tariffs on the EU and total 40% tariffs on China (including
Fentanyl tariff 20%).
Overall, Trump is
now slapping tariffs on various nations from a 20-40/50% range, including
basic/universal tariffs of 10%; earlier in April’25, Trump threatened 10% basic
tariffs + reciprocal tariffs. Now although, Trump didn’t officially announce
tariffs rates on EU, Mexico, China, Canada and India, as per various reports
and assumptions, Trump may impose minimum 10% tariffs on the EU (close ally
despite the allegation of Chinese transshipments), Mexico’s effective rate
12.5%; 50% non-USMCA @25%; Fentanyl 25%; rest USMCA @0%); China 40% (including
Fentanyl tariff@20%); Canada effective rate 15.20% (25% on non-USMCA+ Fossil
fuel and 25% Fentanyl) and India may be slapped by 20-25% (vs 36% on Liberation
day).

Overall, after
considering the pre-Trump 2.0 share of US imports, the weighted average Trump
tariffs may be around 22% from August 1 if implemented at the above indicated
rates against 27% on Liberation Day (April 2). Further, if we adjust the 2.50%
average tariffs in pre-Trump 2.0, the net tariff impact would be around 19-20%
from August 1. Further considering equal sharing of additional tariffs burden
by US importers, consumers, as well as exporters, each stakeholder may have to
digest around 6.50-7.50% on around $3T worth of US merchandise imports
(consumer & industrial goods/raw materials). Although both US importers and
exporters may have to sacrifice some margin to retain market share, it may
affect their bottom line despite some FX (cross currency) adjustments.
But overall, Trump
tariffs may be manageable for US consumers, even after considering the neutral
effect of Trump tax cuts, and also Medicaid/SNAP/Education subsidies cuts. The
cost of living for ordinary Americans is bound to rise, but the overall impact
would be limited on Main Street if Wall Street (US importers) and Global Street
(Exporters-Rest of the World) absorb at least 1/3rd each. But the
question is whether both the US importers and global exporters will absorb
partial Trump tariffs or not?
Another factor
that US exporters may also face is limited reciprocal tariffs and non-Tariffs
regulatory barriers in various EMs, like India. Trump is now desperate to
export US farm products to the rest of the world to gain a vote bank, but this
may not be easy. Apart from various regulatory & cultural hurdles, various
US farm products like Corn and wheat are facing hurdles from internal US issues,
including supply chain disruptions, quality issues and also various regulatory
and Trump tariffs/counter tariffs issues. Canada, Australia are gaining US farm
market share for erstwhile reliable US customers like Thailand and Indonesia.
Thus, Trump wants to export US farm products to big countries like India, China
and also the EU.
India may not get a minimum 10% tariff from Trump:
India may get
20-25% US tariffs vs 36% on Apr 2 Liberation Day instead of a huge tariff
reduction on US goods, along with limited access to farm products. India
constitutes only around 3% of US imports; it does not matter for Trump. But
India needs US trade surplus + remittances ~90B for its FX reserve and to pay a
huge equivalent import bill to China. India also needs the US to counter any
serious geopolitical aggression by China,
But the US and
China are now coming closer under Trump-Xi ‘friendship’ to explore/control
~$10T worth of rare earth materials in Pakistan and Afghanistan. Trump is also extending a soft approach to
Pakistan and Afghanistan. Trump may be planning to control a significant part
of rare earth materials in the region in exchange for past aid in a huge amount
(like Ukraine). As China now processes almost 90% of global rare earth
materials, Trump/US may also outsource it from China for the time being until it
becomes self-reliant. China is also the 2nd biggest market for US
exporters and various MNCs, while both countries control almost 45-50% of
global GDP.
The US and
China both needs each other for economic growth and prosperity, despite their never-ending
geopolitical rivalry. Thus, India may not get any meaningful trade concessions
from Trump on China's ring facing issues. Trump often gives more importance to
China than India as India is a far smaller economy than China.

Cheaper imports from China and other EM exporters helped
US price stability and a Goldilocks economy.
·
Before China and other EM cheap exporters came into the picture,
US inflation was quite elevated during normal times.
·
Pre-1970s: U.S. imports were
primarily from developed economies (e.g., EU, Canada), with higher-cost goods.
Domestic production and unionized labor kept prices elevated.
·
1970s–1980s: China’s economic
reforms (post-1978) and EM industrialization (e.g., South Korea, Taiwan)
increased exports of low-cost goods (e.g., textiles, electronics). U.S. trade
liberalization (e.g., GATT, later WTO) facilitated this.
·
China’s Role: China’s U.S. import
share grew from <1% in 1980 to ~8% by 2000 and ~14% by 2025. Goods like
apparel, electronics, and toys were significantly cheaper due to low labor
costs.
·
EM Exporters: Taiwan
(semiconductors), South Korea (autos, electronics), and later Vietnam (textiles,
electronics) contributed to lower import prices.
·
Inflation Impact: Cheaper imports
reduced goods inflation (e.g., apparel prices fell ~10% from 1990–2000). BLS
data shows CPI inflation dropped from ~7.1% (1970s average) to ~3.0%
(1980s–1990s average), partly due to import competition and Federal Reserve
policies (e.g., Volcker’s high interest rates).
·
The US import
inflation is around 2.0% on average since the 1980s, which is helping the Fed to
maintain the dual mandate of 2% price stability and maximum employment, and the
overall Goldilocks nature of the economy.
Conclusions
Trump may keep around 20-25% tariff rates for most
of the countries, while close allies/trading partners like the EU may get 10%
and permanent adversary countries like China may get 40% (including 20%
Fentanyl tariffs). The potential weighted average tariff rate after Trump’s
latest tariffs, effective August 1, 2025, and various sectoral tariffs
(25%-50%) may be around 22%; China alone constitutes around 14% of total US
merchandise imports. This is slightly lower than the 27% weighted average
tariffs announced on April 2, Liberation Day, and in line with the actual 19.5%
from April’25 (Trump 2.0). But it’s still significantly higher than 2.5%
weighted average rates till January’25 (pre-Trump 2.0).
Trump extended his new tariffs rhetoric to the
August 1 deadline by which various affected countries may have an opportunity
to offer a better deal to the US for getting lower tariffs. Although Trump
should not further extend his tariff deadline as it may keep the Fed on the
sidelines till December’25, considering the looming festival season (X-Mas),
various US retailers and importers may have already placed orders to big
exporters like China, Vietnam, etc. Thus, Trump may not distort the supply
chain further till at least September’25 or even December’25. Although Trump is
issuing a warning that August 1 will be the tariff deal deadline and it will not
be extended further, the market still does not believe Trump’s back-and-forth
narrative.
So, if Trump does not get a better deal, he may
again extend the tariff deadline to September or even December’25. Although
Trump always maintains that exporters like China pay his tariffs, not US
importers, it’s laughable. Tariffs are import duties to be paid by importers
when foreign goods enter the US. Higher tariffs are usually borne by importers
and consumers. But in this case, as the US is the world’s biggest consumer
(departmental stores), exporters may have to sacrifice some margin either from
their own pockets or to be compensated partly by their respective government
(export subsidies).
The Fed is assuming Trump tariffs may be borne
equally by exporters, importers, and US consumers at 1/3rd each. But
Trump’s weighted average tariffs at present rates may be ~22.5%, which would be
much higher than the Fed’s best-case scenario of 15.5% and closer to the base
case scenario of 25.5%. Overall, Fed’s uncertainty may remain at around 22.5%
weighted average tariffs vs 2.5% prior, the cost of living may be higher if
exporters and importers do not absorb at least 70% of the higher tariffs. If
they attempt to retain market share, their margin (EBITDA) will be affected to
some extent; if they do not absorb additional Trump tariffs, the US economy may
head towards a stagflation-like scenario due to subdued discretionary consumer
spending.
Bottom line
Trump’s higher tariffs ~22.5% may cause both
subdued consumer spending and soft corporate report card, both of which are
negative for Main Street as well as Wall Street; it would also be negative for
Global Street if exporters have to bear some cost. Thus, overall, Trump’s
tariffs may cause a synchronized global economic slowdown to some extent, even
if the weighted average tariffs scheduled to be implemented at around a 22.5%
rate vs earlier April 2 levels of 27.5%.
Market
impact
Wall Street surged Wednesday, July 9, on techs
boost on signs of tech & trade war de-escalation between the US and China.
Trump sounded soft on China in his daily media briefings. Trump said: “I have a
good relationship with China’s President Xi, China is paying a lot of tariffs
to the US and opening up for our products & services”.
NVIDIA also led the rally as the AI Chip giant
plans to launch a new AI chip designed specifically for China as soon as
September and the CEO Huang is seeking talks with China’s Premier Li Qiang in
the forthcoming China AI summit; Nvidia briefly touched a $4 trillion market
cap, almost equivalent to India’s nominal GDP and overall stock market capitalization.
The S&P 500 surged 0.6%, snapping a two-day losing streak, while the Dow
added 217 points and the Nasdaq 100 rose 0.7%.
Tech stocks led the day’s gains, led by Nvidia,
Broadcom, Alphabet, and Meta; all closing from deep to moderate green. Also,
utilities, communication services, consumer discretionary, industrials, materials,
healthcare, and financials helped, while consumer staples dragged. Boeing,
Merck, Caterpillar, and Amazon also gave support, while Verizon, UnitedHealth,
Coca-Cola, and Nike dragged.
Boeing may be a beneficiary of Trump’s 50% tariffs
on Brazil as it supplies some Airplanes in the US. UnitedHealth may face some
pressure as Trump’s BBB spending cuts on Medicaid, while Coca-Cola is facing
higher costs for imported aluminum, a key raw material for its canned beverage;
Nike may also face some pressure due to 20% tariffs on Vietnam, a key supply
chain.
USD surged, while Gold slid on Trump’s less hawkish
tariff war tones/rates (5% lower than April 2) and hopes of an imminent Gaza
and Ukraine war ceasefire. Latest FOMC Minutes from the Fed’s June meeting
revealed that officials viewed the newly announced tariffs as inflationary,
leading them to hold. The release came shortly after President Trump expanded
the list of countries facing US tariffs starting August 1, including the
Philippines, Iraq, and potentially Brazil. This followed earlier announcements
of a 50% tariff on copper, as well as plans for levies on semiconductors and a
200% duty on pharmaceuticals after a ½ year grace period.
Trump is trying to bring back global/US MNC
manufacturers to the US, using higher tariffs as an indirect negotiation tool
and embargo to export into the US from foreign soils. But the US needs proper
industrial and logistical infrastructure to compete with mighty China, not
tariffs and geopolitical bullying. Trump’s tariffs may encourage inefficiencies
and higher costs for the US economy if produced in the US.
Technical
outlook: DJ-30, NQ-100, SPX-500 and Gold
Looking
ahead, whatever may be the narrative, technically Dow Future (CMP: 44800) now has to sustain over 45000 for a
further rally towards 45300/45800* and only sustaining above 45800, may further
rally to 46100/46500-47100/47200 in the coming days; otherwise sustaining below
44950, DJ-30 may again fall to 44200/43900-43400/42400 and
41700/41200-40700/39900 in the coming days.
Similarly,
NQ-100 Future (23000) now has
to sustain over 23100 for a further rally to 23200/23600-23800/24000 and
24100/24450-24700/25000 in the coming days; otherwise, sustaining below 22900,
NQ-100 may again fall to 2400/22200-21900/20900-20700/20200 and
19890/18300-17400/16400in the coming days.
Looking
ahead, whatever may be the fundamental narrative, technically SPX-500 (CMP: 6275) now has to sustain over 6400-6450 for
a further rally to 6525/7000-7500/8300 in the coming days; otherwise,
sustaining below 6350/6300-6250/6200, SPX-500may again fall to
6000/5800-5600/5300 in the coming days.
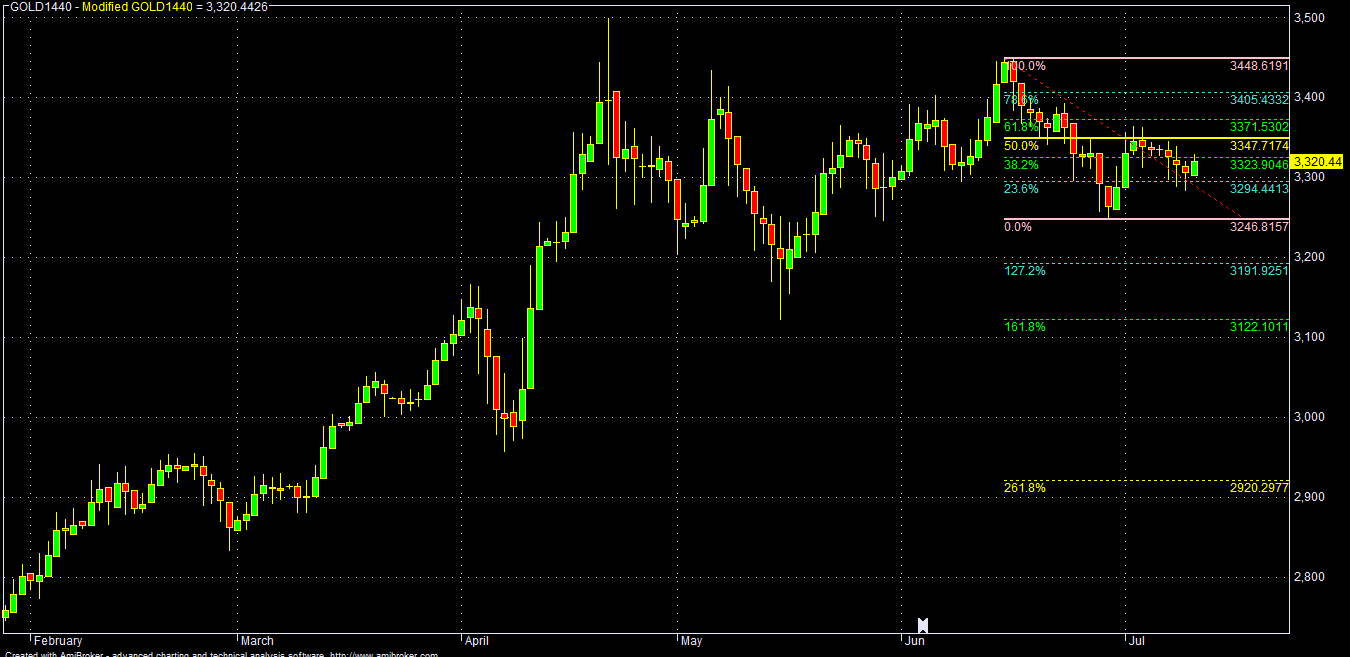
Technically
Gold (CMP: 3350) has to sustain over 3375-3395 for a
further rally to 3405/3425*-3450/3505*, and even 3525/3555 in the coming days;
otherwise sustaining below 3365-3360, Gold may again fall to 3340/3320-3300*/3280
and 3255*/3225*-3200/3165* and further to
3130/3115*-3075/3015-2990/2975-2960*/2900* and 2800/2750 in the coming days.
Disclaimer: I am an NSE-certified market professional (Financial Analyst) and not a SEBI/SEC-registered investment advisor. The article is not a proxy for any trading/investment signal/advice. I am a financial analyst, signal provider, and content writer with over ten years of experience. All views expressed in the blog are strictly personal.
For any professional consultation about the financial market, investing & trading ideas, and real time signals, please DM at: ashishghoshjpg@gmail.com


